Core 2.57% ▲ from 2.45%
Top 20 news (Hang Seng universe · past week)
Most-clicked / important / high-impact stories for Hang Seng constituents (company names or tickers in this universe). Sources: FT, Bloomberg, Reuters, WSJ, Nikkei Asia, S&P Global Ratings, Moody’s. Window: past 7 days. Cap 20.
- HSBC, Standard Chartered Face Cost Test as Rates, Wealth Support Earnings · Bloomberg · 2026-10-23 · hit: HSBC
- EXCLUSIVE: ByteDance, Alibaba, Tencent place over $35 billion worth of Nvidia chip orders · Reuters/The Standard · 2026-10-20 · hit: TENCENT
- Amazon to Hire Over 300,000 in Holiday Season, Up 20% From 2025 · BBG/Reuters/WSJ/The Standard · 2026-10-20 · hit: 300
- BeOne Medicines Reports Sustained Survival Benefit with TEVIMBRA-ZIIHERA Combination in First-Line HER2+ Gastroesophageal Cancer – Company Announcement - FT.com · FT · 2026-10-23 · hit: BEONE MEDICINES
- Li Ning Co. Ltd. ADR (LNNGY) Options · WSJ · 2026-10-21 · hit: LI NING
- HSBC RedCoin stablecoin launches for 3.3 million PayMe users in Hong Kong - South China Morning Post · SCMP · 2026-10-22 · hit: HSBC
- HSBC reviews Palantir holding in $9bn Islamic fund · FT · 2026-10-20 · hit: HSBC
- Former HSBC insurance veteran joins AIA in latest senior talent move - South China Morning Post · SCMP · 2026-10-23 · hit: HSBC
Same logic as AT1 CoCo bank-news box: multi-source Google News RSS · last 7 days · deduped by URL/topic with wire-rewrite collapse (winner headline; outlets joined e.g. WSJ/BBG) · impact/importance/clicks-proxy + round-robin · max 20 · agency headlines prefer rating actions / outlook / CreditWatch. · fetched 2026-10-24 14:18:36
vs HSI YTD / vs HSI 24m = that stock’s YTD or 24-month total return minus the Hang Seng index total return over the same period (positive = beat the index; negative = lagged). Index source shown in the cards above.
Ask Gemini opens Google AI Mode (Gemini) with your question prefilled —
native gemini.google.com has no reliable ?q= deep link.
Open Gemini app copies the question and opens the Gemini chat UI for paste.
Ticker filter above stays separate.
“Why is Meituan down so much both YTD and 24mth? What is going on?”
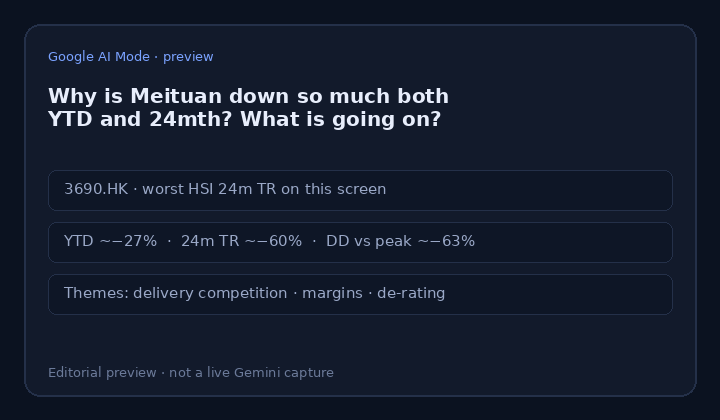
Meituan (3690.HK) is the worst Hang Seng name on this screen’s default 24m TR ranking (as of 20 Oct 2026): YTD ~−27% / 24m ~−60%, with price drawdown vs 24m high ~−63% (peak 2024-11-07). Shared drivers in recent coverage: intense food-delivery and in-store competition and subsidy cycles in China; slower local-services growth and margin pressure after the post-reopening boom; regulatory and platform-economy overhang; and a de-rating versus peers as investors rotated toward stronger HK tech/financials. The stock remains a large HSI consumer-discretionary weight, so drawdowns have been highly visible versus the index.
Preview · themes from recent coverage (not a live Gemini capture)
Themes drawn from FT / Bloomberg / Reuters / Nikkei / SCMP Meituan & China internet coverage (2024–2026); YTD / 24m TR and drawdown from this Hang Seng monitor (3690.HK Adj Close).
“What's going on with Hang Seng Index relative to S&P 500 over the past 2 years?”
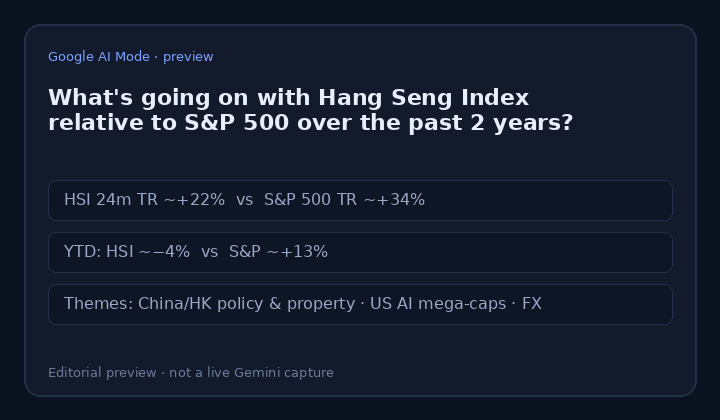
Over ~24 months the Hang Seng TR proxy (2800.HK) is up about +22% while the S&P 500 TR (^SP500TR) is up about +34% (as of mid/late Oct 2026); year-to-date the gap is sharper — HSI roughly −4% vs S&P ~+13%. Shared themes in recent coverage: China growth / property and policy overhang weighing on HK-listed mainland names; stronger US earnings and AI-led mega-cap leadership lifting the S&P; and FX / rate differentials that favoured USD risk assets versus HK/China equities for much of the window. Within HSI, breadth is mixed — a handful of tech and financials outperformed while consumer discretionary and property lagged.
Preview · themes from recent coverage (not a live Gemini capture)
Themes drawn from FT / Bloomberg / Reuters / Nikkei / SCMP Hang Seng & China equity coverage (2024–2026); total-return figures from this monitor (^SP500TR · 2800.HK).
Sorts the main table below. # = worst first under the active mode (default 24m TR). Restore original returns to that mode after a column-header sort.
| # | Ticker | Company | Sector | Industry | Market Cap USD bn |
EV USD bn |
EV/ EBITDA TTM multiple |
YTD TR | 24m TR | 12m TR | TR from peak | vs S&P YTD |
vs S&P 24m |
Price drawdown vs peak |
Max drawdown (24m) |
Peak date |
|---|---|---|---|---|---|---|---|---|---|---|---|---|---|---|---|---|
| 1 | 3690 | MEITUAN - W | Consumer Discretionary and Consumer Staples | Consumer Discretionary and Consumer Staples | 442.2 | 369.7 | -9.7 | -30.3% | -63.2% | -28.4% | -64.2% | -23.0% | -81.5% | -64.2% | -67.9% | 2024-11-07 |
| 2 | 960 | LONGFOR GROUP | Properties & Construction | Properties & Construction | 34.0 | 241.1 | 373.1 | -41.7% | -59.5% | -51.8% | -64.6% | -34.4% | -77.8% | -66.1% | -67.4% | 2024-11-07 |
| 3 | 2015 | LI AUTO - W | Consumer Discretionary and Consumer Staples | Consumer Discretionary and Consumer Staples | 88.1 | 18.6 | -16.6 | -30.3% | -58.0% | -48.1% | -65.0% | -23.0% | -76.3% | -65.0% | -67.1% | 2025-02-26 |
| 4 | 968 | XINYI SOLAR | Energy, Materials, Industrials and Conglomerates | Energy, Materials, Industrials and Conglomerates | 16.5 | 29.0 | 6.4 | -38.6% | -51.4% | -46.6% | -56.0% | -31.3% | -69.7% | -56.8% | -56.8% | 2024-10-25 |
| 5 | 1024 | KUAISHOU - W | Consumer Discretionary and Consumer Staples | Consumer Discretionary and Consumer Staples | 120.0 | 79.0 | 3.8 | -55.5% | -39.4% | -61.4% | -69.1% | -48.2% | -57.7% | -69.6% | -70.8% | 2025-10-02 |
| 6 | 2618 | JD LOGISTICS | Energy, Materials, Industrials and Conglomerates | Energy, Materials, Industrials and Conglomerates | 60.6 | 65.0 | 5.5 | -13.3% | -38.4% | -21.9% | -39.4% | -6.0% | -56.7% | -39.4% | -40.8% | 2024-10-25 |
| 7 | 9618 | JD - SW | Consumer Discretionary and Consumer Staples | Consumer Discretionary and Consumer Staples | 273.2 | 215.7 | 18.3 | -9.8% | -36.6% | -21.9% | -43.7% | -2.5% | -54.9% | -44.1% | -46.4% | 2025-03-06 |
| 8 | 1928 | SANDS CHINA LTD | Consumer Discretionary and Consumer Staples | Consumer Discretionary and Consumer Staples | 88.9 | 94.4 | 46.6 | -39.9% | -34.9% | -38.6% | -46.8% | -32.6% | -53.2% | -50.5% | -51.1% | 2025-09-29 |
| 9 | 9961 | TRIP.COM - S | Consumer Discretionary and Consumer Staples | Consumer Discretionary and Consumer Staples | 198.2 | 148.1 | 13.0 | -43.2% | -34.3% | -42.5% | -48.3% | -35.9% | -52.6% | -48.3% | -51.4% | 2026-01-13 |
| 10 | 6862 | HAIDILAO | Consumer Discretionary and Consumer Staples | Consumer Discretionary and Consumer Staples | 50.0 | 49.6 | 7.4 | -30.9% | -34.3% | -25.5% | -44.4% | -23.6% | -52.6% | -50.6% | -51.4% | 2025-03-27 |
| 11 | 2313 | SHENZHOU INTL | Consumer Discretionary and Consumer Staples | Consumer Discretionary and Consumer Staples | 55.7 | 42.6 | 6.7 | -36.1% | -33.1% | -43.1% | -46.0% | -28.8% | -51.4% | -48.6% | -53.6% | 2025-11-13 |
| 12 | 285 | BYD ELECTRONIC | Information Technology | Information Technology | 50.4 | 45.7 | 5.8 | -32.8% | -32.9% | -39.8% | -62.0% | -25.5% | -51.2% | -62.9% | -66.5% | 2025-02-12 |
| 13 | 291 | CHINA RES BEER | Consumer Discretionary and Consumer Staples | Consumer Discretionary and Consumer Staples | 62.8 | 54.1 | 6.8 | -22.2% | -31.2% | -24.4% | -34.0% | -14.9% | -49.5% | -39.5% | -43.2% | 2024-11-07 |
| 14 | 6690 | HAIER SMARTHOME (H) | Consumer Discretionary and Consumer Staples | Consumer Discretionary and Consumer Staples | 180.5 | 159.8 | 6.4 | -16.3% | -29.3% | -18.4% | -28.7% | -9.0% | -47.6% | -35.8% | -37.2% | 2024-10-24 |
| 15 | 1211 | BYD COMPANY (H) | Consumer Discretionary and Consumer Staples | Consumer Discretionary and Consumer Staples | 652.8 | 660.3 | 5.6 | -24.4% | -24.6% | -30.8% | -53.1% | -17.1% | -42.9% | -53.8% | -56.5% | 2025-05-23 |
| 16 | 241 | ALI HEALTH | Healthcare | Healthcare | 46.3 | 36.0 | 19.4 | -39.6% | -24.0% | -48.5% | -60.7% | -32.3% | -42.3% | -63.2% | -63.9% | 2026-01-14 |
| 17 | 762 | CHINA UNICOM | Telecommunications and Utilities | Telecommunications and Utilities | 159.1 | 114.0 | 1.5 | -31.7% | -21.9% | -43.5% | -48.4% | -24.4% | -40.2% | -51.9% | -51.9% | 2025-02-21 |
| 18 | 1876 | BUD APAC | Consumer Discretionary and Consumer Staples | Consumer Discretionary and Consumer Staples | 79.5 | 77.4 | 55.6 | -15.9% | -20.9% | -21.6% | -30.9% | -8.6% | -39.2% | -38.3% | -42.4% | 2025-03-19 |
| 19 | 2057 | ZTO EXPRESS - W | Energy, Materials, Industrials and Conglomerates | Energy, Materials, Industrials and Conglomerates | 117.3 | 110.2 | 7.4 | -3.0% | -19.2% | +5.9% | -23.0% | +4.3% | -37.5% | -23.0% | -31.1% | 2026-04-21 |
| 20 | 1099 | SINOPHARM (H) | Healthcare | Healthcare | 47.9 | 149.3 | 7.8 | -17.0% | -18.2% | -17.7% | -24.3% | -9.7% | -36.5% | -30.7% | -33.6% | 2024-12-16 |
| 21 | 9888 | BIDU - SW | Consumer Discretionary and Consumer Staples | Consumer Discretionary and Consumer Staples | 206.9 | 177.6 | 7.6 | -42.2% | -14.4% | -34.8% | -52.7% | -34.9% | -32.7% | -52.7% | -53.2% | 2026-01-23 |
| 22 | 688 | CHINA OVERSEAS | Properties & Construction | Properties & Construction | 136.4 | 287.1 | 14.3 | +5.8% | -11.4% | -6.4% | -21.5% | +13.1% | -29.7% | -24.5% | -27.6% | 2026-05-15 |
| 23 | 2331 | LI NING | Consumer Discretionary and Consumer Staples | Consumer Discretionary and Consumer Staples | 32.7 | 19.8 | 4.1 | -28.2% | -9.2% | -27.8% | -41.8% | -20.9% | -27.5% | -44.4% | -46.8% | 2026-04-10 |
| 24 | 2020 | ANTA SPORTS | Consumer Discretionary and Consumer Staples | Consumer Discretionary and Consumer Staples | 208.6 | 205.0 | 9.2 | -3.0% | -8.2% | -11.6% | -24.3% | +4.3% | -26.5% | -27.9% | -35.3% | 2025-08-25 |
| 25 | 700 | TENCENT | Information Technology | Information Technology | 3475.8 | 3574.4 | 12.0 | -34.8% | -8.0% | -38.3% | -42.4% | -27.5% | -26.3% | -43.0% | -43.6% | 2025-10-06 |
| 26 | 9901 | NEW ORIENTAL - S | Consumer Discretionary and Consumer Staples | Consumer Discretionary and Consumer Staples | 72.0 | 68.0 | 82.8 | +10.3% | -7.0% | -0.6% | -8.6% | +17.6% | -25.3% | -8.7% | -35.3% | 2026-02-04 |
| 27 | 2688 | ENN ENERGY | Telecommunications and Utilities | Telecommunications and Utilities | 53.4 | 70.6 | 6.1 | -27.1% | -6.5% | -24.3% | -32.0% | -19.8% | -24.8% | -34.9% | -45.2% | 2025-12-05 |
| 28 | 1044 | HENGAN INT'L | Consumer Discretionary and Consumer Staples | Consumer Discretionary and Consumer Staples | 22.7 | 22.2 | 5.4 | -24.3% | -5.5% | -22.9% | -28.5% | -17.0% | -23.8% | -33.3% | -35.0% | 2026-02-26 |
| 29 | 868 | XINYI GLASS | Energy, Materials, Industrials and Conglomerates | Energy, Materials, Industrials and Conglomerates | 34.5 | 36.3 | 7.4 | -2.0% | -2.6% | -10.8% | -30.6% | +5.3% | -20.9% | -33.2% | -33.2% | 2026-03-02 |
| 30 | 27 | GALAXY ENT | Consumer Discretionary and Consumer Staples | Consumer Discretionary and Consumer Staples | 138.4 | 127.9 | 9.6 | -13.1% | +0.4% | -12.6% | -24.3% | -5.8% | -17.9% | -28.0% | -33.5% | 2026-02-09 |
| 31 | 9988 | BABA - W | Consumer Discretionary and Consumer Staples | Consumer Discretionary and Consumer Staples | 1946.4 | 1771.7 | 17.8 | -31.4% | +0.8% | -40.5% | -47.1% | -24.1% | -17.5% | -47.2% | -51.6% | 2025-10-03 |
| 32 | 175 | GEELY AUTO | Consumer Discretionary and Consumer Staples | Consumer Discretionary and Consumer Staples | 153.7 | 103.2 | 5.3 | -18.5% | +2.5% | -24.7% | -41.4% | -11.2% | -15.8% | -43.0% | -43.5% | 2026-04-10 |
| 33 | 728 | CHINA TELECOM (H) | Telecommunications and Utilities | Telecommunications and Utilities | 394.9 | 358.0 | 3.6 | -15.3% | +3.0% | -19.2% | -28.4% | -8.0% | -15.3% | -35.8% | -36.5% | 2025-02-21 |
| 34 | 1810 | XIAOMI - W | Information Technology | Information Technology | 689.8 | 611.6 | 21.7 | -31.6% | +4.9% | -42.7% | -55.4% | -24.3% | -13.4% | -55.4% | -64.4% | 2025-07-02 |
| 35 | 836 | CHINA RES POWER | Telecommunications and Utilities | Telecommunications and Utilities | 96.1 | 327.3 | 8.4 | +13.6% | +6.5% | +6.7% | -9.7% | +20.9% | -11.8% | -14.4% | -23.2% | 2026-06-03 |
| 36 | 386 | SINOPEC CORP (H) | Energy, Materials, Industrials and Conglomerates | Energy, Materials, Industrials and Conglomerates | 538.2 | 1082.1 | 6.8 | +1.4% | +7.6% | +12.5% | -16.5% | +8.7% | -10.7% | -21.2% | -29.3% | 2026-02-12 |
| 37 | 101 | HANG LUNG PPT | Properties & Construction | Properties & Construction | 32.5 | 91.5 | 15.2 | -22.6% | +8.9% | -24.6% | -35.3% | -15.3% | -9.4% | -39.1% | -39.4% | 2026-02-27 |
| 38 | 2318 | PING AN (H) | Financials | Financials | 887.6 | -266.9 | -1.0 | -20.8% | +10.6% | -6.8% | -29.6% | -13.4% | -7.7% | -33.3% | -34.0% | 2026-02-10 |
| 39 | 12 | HENDERSON LAND | Properties & Construction | Properties & Construction | 132.4 | 286.2 | 42.9 | +1.6% | +17.6% | +3.8% | -19.3% | +8.9% | -0.7% | -22.9% | -30.0% | 2026-02-27 |
| 40 | 823 | LINK REIT | Properties & Construction | Properties & Construction | 98.4 | 153.4 | 15.9 | +13.3% | +17.7% | +0.5% | -8.7% | +20.6% | -0.6% | -14.8% | -23.3% | 2025-08-13 |
| 41 | 322 | TINGYI | Consumer Discretionary and Consumer Staples | Consumer Discretionary and Consumer Staples | 69.6 | 70.6 | 7.1 | +13.7% | +18.4% | +22.3% | 0.9% | +21.0% | +0.1% | -12.2% | -32.3% | 2025-05-06 |
| 42 | 669 | TECHTRONIC IND | Consumer Discretionary and Consumer Staples | Consumer Discretionary and Consumer Staples | 235.6 | 235.5 | 136.9 | +46.7% | +18.9% | +37.2% | -11.7% | +54.0% | +0.6% | -12.7% | -37.5% | 2026-08-10 |
| 43 | 2319 | MENGNIU DAIRY | Consumer Discretionary and Consumer Staples | Consumer Discretionary and Consumer Staples | 71.9 | 86.2 | 11.1 | +30.1% | +19.4% | +34.3% | -1.1% | +37.4% | +1.1% | -7.8% | -30.3% | 2025-04-14 |
| 44 | 941 | CHINA MOBILE | Telecommunications and Utilities | Telecommunications and Utilities | 1671.8 | 1446.3 | 5.9 | +0.8% | +20.2% | -3.2% | -6.0% | +8.1% | +1.9% | -14.7% | -15.7% | 2025-08-25 |
| 45 | 1299 | AIA | Financials | Financials | 732.0 | 747.0 | 84.2 | -9.1% | +21.9% | +2.7% | -20.0% | -1.8% | +3.6% | -21.9% | -24.4% | 2026-01-29 |
| 46 | 66 | MTR CORPORATION | Consumer Discretionary and Consumer Staples | Consumer Discretionary and Consumer Staples | 201.3 | 311.6 | 8.8 | +13.5% | +22.7% | +23.0% | -10.1% | +20.8% | +4.4% | -13.7% | -18.8% | 2026-02-24 |
| 47 | 1109 | CHINA RES LAND | Properties & Construction | Properties & Construction | 210.4 | 553.4 | 13.6 | +12.7% | +23.3% | +4.2% | -20.2% | +19.9% | +5.0% | -23.2% | -25.8% | 2026-05-11 |
| 48 | 2 | CLP HOLDINGS | Telecommunications and Utilities | Telecommunications and Utilities | 192.1 | 259.5 | 10.9 | +13.4% | +24.8% | +20.4% | -3.9% | +20.7% | +6.5% | -4.7% | -8.6% | 2026-08-21 |
| 49 | 388 | HKEX | Financials | Financials | 468.7 | 302.3 | 12.5 | -6.0% | +25.2% | -9.1% | -16.1% | +1.3% | +6.9% | -19.9% | -21.7% | 2025-08-25 |
| 50 | 288 | WH GROUP | Consumer Discretionary and Consumer Staples | Consumer Discretionary and Consumer Staples | 81.3 | 84.2 | 24.5 | -21.4% | +28.1% | -6.6% | -37.0% | -14.1% | +9.8% | -41.5% | -42.3% | 2026-04-10 |
| 51 | 3 | HK & CHINA GAS | Telecommunications and Utilities | Telecommunications and Utilities | 133.7 | 199.9 | 17.2 | +7.3% | +29.7% | +3.9% | -2.9% | +14.6% | +11.4% | -7.5% | -17.0% | 2026-02-16 |
| 52 | 6 | POWER ASSETS | Telecommunications and Utilities | Telecommunications and Utilities | 129.0 | 86.5 | 226.2 | +14.6% | +29.9% | +26.9% | -4.5% | +21.9% | +11.6% | -8.7% | -15.9% | 2026-05-06 |
| 53 | 6618 | JD HEALTH | Healthcare | Healthcare | 119.9 | 71.1 | 14.0 | -32.3% | +31.5% | -39.1% | -46.0% | -25.0% | +13.2% | -46.0% | -54.1% | 2026-01-14 |
| 54 | 2600 | CHALCO (H) | Energy, Materials, Industrials and Conglomerates | Energy, Materials, Industrials and Conglomerates | 128.1 | 187.5 | 3.5 | -37.9% | +33.5% | -13.7% | -49.8% | -30.6% | +15.2% | -52.6% | -55.7% | 2026-01-28 |
| 55 | 300 | MIDEA GROUP (H) | Consumer Discretionary and Consumer Staples | Consumer Discretionary and Consumer Staples | 721.8 | 607.0 | 11.4 | +17.6% | +33.8% | +20.1% | -6.7% | +24.9% | +15.5% | -6.7% | -20.9% | 2026-08-31 |
| 56 | 2382 | SUNNY OPTICAL | Information Technology | Information Technology | 67.8 | 54.4 | 8.6 | -2.2% | +34.1% | -18.4% | -31.1% | +5.1% | +15.8% | -32.8% | -43.9% | 2025-02-27 |
| 57 | 1209 | CHINA RES MIXC | Properties & Construction | Properties & Construction | 88.7 | 75.7 | 14.2 | -4.9% | +34.2% | +0.1% | -18.6% | +2.4% | +15.9% | -22.7% | -27.0% | 2026-05-12 |
| 58 | 1038 | CKI HOLDINGS | Telecommunications and Utilities | Telecommunications and Utilities | 169.6 | 136.0 | 156.0 | +21.5% | +34.7% | +36.9% | -1.2% | +28.8% | +16.4% | -1.2% | -19.7% | 2026-10-13 |
| 59 | 16 | SHK PPT | Properties & Construction | Properties & Construction | 305.7 | 379.8 | 14.2 | +12.6% | +36.0% | +17.0% | -27.8% | +19.9% | +17.7% | -27.8% | -28.8% | 2026-05-06 |
| 60 | 1088 | CHINA SHENHUA (H) | Energy, Materials, Industrials and Conglomerates | Energy, Materials, Industrials and Conglomerates | 859.3 | 997.0 | 10.0 | +8.3% | +37.3% | +4.5% | -14.9% | +15.6% | +19.0% | -19.6% | -20.9% | 2026-04-29 |
| 61 | 1997 | WHARF REIC | Properties & Construction | Properties & Construction | 92.1 | 126.5 | 13.3 | +30.7% | +39.7% | +42.2% | -6.7% | +38.0% | +21.4% | -9.4% | -30.1% | 2026-08-21 |
| 62 | 883 | CNOOC | Energy, Materials, Industrials and Conglomerates | Energy, Materials, Industrials and Conglomerates | 1098.9 | 843.2 | 3.2 | +15.2% | +39.9% | +23.1% | -19.6% | +22.5% | +21.6% | -24.2% | -33.4% | 2026-03-23 |
| 63 | 3968 | CM BANK (H) | Financials | Financials | 1297.6 | 492.3 | — | +2.0% | +40.0% | +8.1% | -0.5% | +9.3% | +21.7% | -8.9% | -22.4% | 2025-06-26 |
| 64 | 1177 | SBP GROUP | Healthcare | Healthcare | 89.0 | 92.5 | 8.9 | -17.1% | +41.5% | -26.8% | -43.1% | -9.8% | +23.2% | -44.5% | -52.7% | 2025-09-08 |
| 65 | 267 | CITIC | Energy, Materials, Industrials and Conglomerates | Energy, Materials, Industrials and Conglomerates | 346.8 | 1605.0 | 4.9 | +4.7% | +42.4% | +9.2% | -12.8% | +12.0% | +24.1% | -14.3% | -23.2% | 2026-09-04 |
| 66 | 1093 | CSPC PHARMA | Healthcare | Healthcare | 95.2 | 79.2 | 8.0 | +3.2% | +44.4% | +6.1% | -23.0% | +10.5% | +26.1% | -27.3% | -42.1% | 2025-09-08 |
| 67 | 9633 | NONGFU SPRING (H) | Consumer Discretionary and Consumer Staples | Consumer Discretionary and Consumer Staples | 467.0 | 440.0 | 17.8 | -9.0% | +44.7% | -21.7% | -24.0% | -1.7% | +26.4% | -26.0% | -31.6% | 2025-11-12 |
| 68 | 9999 | NTES | Information Technology | Information Technology | 585.9 | 427.8 | 9.9 | -14.7% | +46.4% | -19.6% | -25.5% | -7.4% | +28.1% | -25.7% | -30.8% | 2025-09-17 |
| 69 | 1113 | CK ASSET | Properties & Construction | Properties & Construction | 154.4 | 139.3 | 11.5 | +16.3% | +48.0% | +20.5% | -12.3% | +23.6% | +29.7% | -15.5% | -19.3% | 2026-05-07 |
| 70 | 1519 | J&T EXPRESS - W | Energy, Materials, Industrials and Conglomerates | Energy, Materials, Industrials and Conglomerates | 85.4 | 81.4 | 70.8 | -14.8% | +48.8% | -13.4% | -25.6% | -7.5% | +30.4% | -25.6% | -32.7% | 2026-01-09 |
| 71 | 2628 | CHINA LIFE (H) | Financials | Financials | 665.4 | -1339.1 | -4.2 | -10.6% | +52.2% | -0.2% | -30.9% | -3.3% | +33.9% | -33.7% | -36.3% | 2026-01-29 |
| 72 | 1929 | CHOW TAI FOOK | Consumer Discretionary and Consumer Staples | Consumer Discretionary and Consumer Staples | 107.6 | 127.0 | 6.7 | -8.5% | +54.6% | -26.3% | -30.7% | -1.2% | +36.3% | -34.4% | -36.7% | 2025-10-21 |
| 73 | 316 | OOIL | Energy, Materials, Industrials and Conglomerates | Energy, Materials, Industrials and Conglomerates | 99.3 | 94.7 | 64.7 | +26.4% | +59.9% | +23.4% | -12.6% | +33.7% | +41.6% | -15.0% | -23.8% | 2026-08-24 |
| 74 | 6181 | LAOPU GOLD (H) | Consumer Discretionary and Consumer Staples | Consumer Discretionary and Consumer Staples | 50.3 | 54.6 | 5.9 | -52.9% | +60.9% | -57.2% | -72.6% | -45.6% | +42.6% | -73.7% | -73.7% | 2025-07-08 |
| 75 | 981 | SMIC | Information Technology | Information Technology | 402.9 | 416.8 | 78.9 | -34.0% | +61.4% | -36.5% | -48.3% | -26.7% | +43.1% | -48.3% | -48.6% | 2025-10-06 |
| 76 | 1378 | CHINAHONGQIAO | Energy, Materials, Industrials and Conglomerates | Energy, Materials, Industrials and Conglomerates | 186.8 | 209.8 | 4.3 | -38.2% | +63.5% | -24.4% | -50.0% | -30.9% | +45.2% | -52.7% | -55.2% | 2026-01-28 |
| 77 | 3692 | HANSOH PHARMA | Healthcare | Healthcare | 200.1 | 166.9 | 26.5 | -7.2% | +64.3% | -2.6% | -22.8% | +0.1% | +46.0% | -23.9% | -34.1% | 2025-12-11 |
| 78 | 1 | CKH HOLDINGS | Energy, Materials, Industrials and Conglomerates | Energy, Materials, Industrials and Conglomerates | 246.5 | 515.0 | 10.7 | +26.1% | +66.7% | +30.8% | -12.1% | +33.4% | +48.4% | -13.0% | -25.1% | 2026-08-04 |
| 79 | 6160 | BEONE MEDICINES | Healthcare | Healthcare | 337.8 | 334.6 | 312.2 | +27.1% | +70.7% | +23.5% | -1.3% | +34.4% | +52.4% | -1.3% | -32.1% | 2026-10-21 |
| 80 | 1398 | ICBC (H) | Financials | Financials | 2580.4 | 6160.0 | — | +22.2% | +74.6% | +29.0% | -3.8% | +29.5% | +56.3% | -6.1% | -13.2% | 2026-09-30 |
| 81 | 3988 | BANK OF CHINA (H) | Financials | Financials | 1918.8 | 7927.0 | — | +37.2% | +77.2% | +42.8% | -5.0% | +44.5% | +58.9% | -5.0% | -13.2% | 2026-10-13 |
| 82 | 9992 | POP MART | Consumer Discretionary and Consumer Staples | Consumer Discretionary and Consumer Staples | 174.1 | 164.1 | 8.5 | -29.2% | +79.0% | -42.3% | -60.0% | -21.9% | +60.7% | -60.7% | -61.7% | 2025-08-26 |
| 83 | 2899 | ZIJIN MINING (H) | Energy, Materials, Industrials and Conglomerates | Energy, Materials, Industrials and Conglomerates | 783.4 | 917.8 | 6.8 | -15.0% | +79.4% | -4.6% | -34.3% | -7.7% | +61.1% | -36.1% | -40.6% | 2026-01-29 |
| 84 | 857 | PETROCHINA (H) | Energy, Materials, Industrials and Conglomerates | Energy, Materials, Industrials and Conglomerates | 1757.9 | 2082.9 | 4.3 | +21.6% | +79.6% | +27.2% | -15.3% | +28.9% | +61.3% | -20.2% | -29.5% | 2026-04-30 |
| 85 | 939 | CCB (H) | Financials | Financials | 2554.5 | 7599.9 | — | +31.1% | +79.9% | +30.9% | -2.1% | +38.4% | +61.6% | -2.1% | -14.2% | 2026-10-15 |
| 86 | 1801 | INNOVENT BIO | Healthcare | Healthcare | 145.1 | 126.9 | 70.4 | +9.1% | +84.9% | -2.2% | -24.2% | +16.4% | +66.6% | -24.2% | -32.2% | 2026-08-26 |
| 87 | 3993 | CMOC (H) | Energy, Materials, Industrials and Conglomerates | Energy, Materials, Industrials and Conglomerates | 278.3 | 287.2 | 4.6 | -30.9% | +97.7% | -12.7% | -46.2% | -23.6% | +79.4% | -47.5% | -48.6% | 2026-03-02 |
| 88 | 2388 | BOC HONG KONG | Financials | Financials | 516.8 | -336.5 | — | +30.2% | +109.5% | +38.9% | -8.9% | +37.5% | +91.2% | -8.9% | -13.6% | 2026-09-14 |
| 89 | 992 | LENOVO GROUP | Information Technology | Information Technology | 280.8 | 282.9 | 72.2 | +147.8% | +117.2% | +105.6% | -39.8% | +155.1% | +98.9% | -39.8% | -44.9% | 2026-09-18 |
| 90 | 2338 | WEICHAI POWER (H) | Energy, Materials, Industrials and Conglomerates | Energy, Materials, Industrials and Conglomerates | 212.5 | 220.4 | 7.6 | +34.9% | +122.0% | +68.5% | -43.1% | +42.2% | +103.7% | -44.9% | -45.7% | 2026-05-06 |
| 91 | 5 | HSBC HOLDINGS | Financials | Financials | 2436.7 | 2064.2 | — | +21.0% | +129.6% | +45.1% | -14.9% | +28.3% | +111.3% | -15.3% | -22.1% | 2026-07-31 |
| 92 | 2269 | WUXI BIO | Healthcare | Healthcare | 188.5 | 184.2 | 20.4 | +45.7% | +171.7% | +29.0% | -20.9% | +53.0% | +153.3% | -20.9% | -37.5% | 2026-10-06 |
| 93 | 1347 | HUA HONG GRACE | Information Technology | Information Technology | 157.6 | 119.4 | 158.3 | -9.0% | +194.5% | -6.9% | -68.7% | -1.7% | +176.2% | -68.7% | -69.1% | 2026-06-30 |
| 94 | 2359 | WUXI APPTEC (H) | Healthcare | Healthcare | 564.5 | 512.1 | 19.9 | +90.9% | +267.1% | +77.8% | -14.9% | +98.2% | +248.8% | -14.9% | -33.1% | 2026-10-06 |
| 95 | 3750 | CATL (H) | Energy, Materials, Industrials and Conglomerates | Energy, Materials, Industrials and Conglomerates | 1651.0 | 1434.2 | 11.7 | -28.4% | — | -32.3% | -54.1% | -21.1% | — | -54.2% | -56.6% | 2026-06-02 |
Names now ≤ −35% by sector
NOW = close as of 23 Oct 2026. ≤ −35% = price vs 24m high (Close ÷ peak Close − 1), not total return. Sectors = GICS Sector (11 groups).
| Sector | Count |
|---|---|
| Consumer Discretionary and Consumer Staples | 19 |
| Energy, Materials, Industrials and Conglomerates | 8 |
| Sector | Count |
|---|---|
| Information Technology | 6 |
| Healthcare | 3 |
| Sector | Count |
|---|---|
| Properties & Construction | 2 |
| Telecommunications and Utilities | 2 |
Column definitions
- Market Cap (USD bn) — Equity market capitalization from yfinance, in USD billions. Multi-class issuers show one company total on the Class A row.
- EV (USD bn) — Enterprise Value = yfinance
enterpriseValue(market cap + total debt − cash & cash equivalents; preferred / minority interest when included in the feed). - EV/EBITDA TTM multiple — EV ÷ trailing-twelve-month EBITDA. Primary: Yahoo Finance info
enterpriseValue÷ebitda. Secondary (when primary EBITDA is missing): Yahoo quarterly income statement — sum of last 4 reported quarters' EBITDA (else EBIT / Operating Income + Reconciled Depreciation). When EBITDA is negative, the multiple is negative and shown in red. Blank — only if EV or EBITDA is missing (banks/financials often have no EBITDA line); not blank for negative EBITDA. - YTD / 12m / 24m TR — Total return including dividends (Adj Close) over year-to-date, ~12 months, and ~24 months.
- vs S&P YTD / 24m — As labeled: stock TR minus Hang Seng index TR over the same window (positive = beat the Hang Seng).
- Price drawdown vs peak / Max drawdown (24m) — Price-only (Close): how far the latest close sits below the ~24m high; largest peak-to-trough fall in that window.